Owners rarely lack numbers. They lack one place where the numbers agree. Sales sit in the accounting software, leads in the CRM, jobs on a calendar, and a spreadsheet somebody built in 2021 tries to join them up. An AI KPI dashboard for small business puts the few figures you actually steer by on one screen, and adds something a normal dashboard can’t: a business dashboard you can ask questions.
Pick the questions before the charts
A dashboard fails when it starts from “what can we show?” Start from what you’d want to know on a Monday morning.
- Name the decisions. Hire or wait? Chase payments or push sales? Which service gets the next ad dollar?
- Write the question under each. “Are we collecting what we invoice?” is a question. “Finances” is not.
- Choose one number per question. If you need three to answer it, the question is too big.
- Say where it comes from. If no system holds it today, that is a finding, and often the first job.
- Stop at eight. More than that and nobody can tell which figure matters.
A first screen
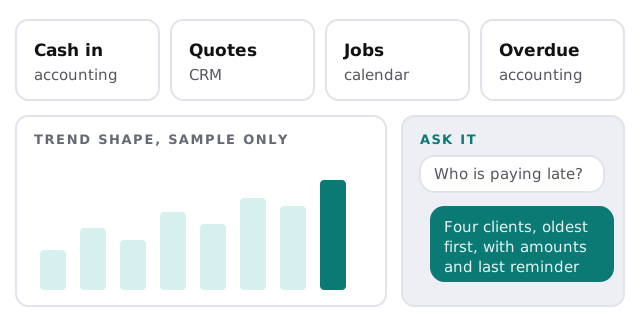
What each tile is made of
| Tile | Question it answers | Usual source | Watch out for |
|---|---|---|---|
| Cash in | Are we being paid? | Accounting software | Deposits counted twice |
| Open quotes | Is there work coming? | CRM or quoting tool | Old quotes nobody closed |
| Jobs this week | Is the schedule full? | Calendar or job tool | Cancelled jobs left on |
| Overdue invoices | Who do we chase? | Accounting software | Disputed invoices mixed in |
When two reports disagree
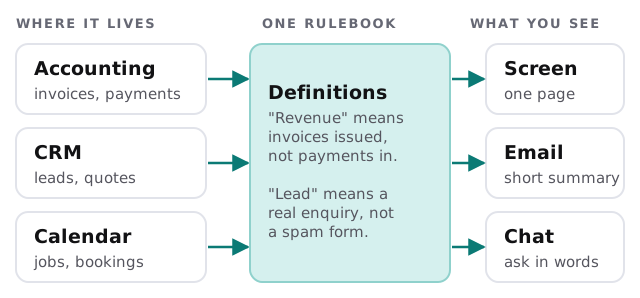
Sooner or later the CRM says you closed more deals than accounting says you billed. Neither is lying. They are counting different things: one counts a signed quote, the other counts an issued invoice.
The fix is a short rulebook that says what each word means. “Revenue” is invoices issued. “A lead” is a real enquiry and not a spam form. Once it’s written, every tile follows it, and the dashboard can point to the gap instead of hiding it.
Where the AI earns its place
Asking instead of filtering
Rather than building a report for each question, you type it. “Which clients are paying late?” “What did we quote last month and win?” The assistant reads the same figures the tiles use and answers in a sentence, listing what it looked at.
A short written summary
Some owners don’t want another screen. A plain email each week, saying what moved and what to look at, does the same job.
What it shouldn’t do
- Calculate the totals itself. Those come from fixed formulas you can audit.
- Guess when a source is missing. It says the data hasn’t updated.
- Make decisions. It suggests where to look, and you decide.
Signs you’re ready for one
- You rebuild the same spreadsheet every month.
- Your bookkeeper and your sales lead quote different totals.
- You find out about a slow month after it ends.
- You can’t say which marketing spend led to work.
Rather build it yourself?
Many accounting and CRM tools have built-in reports, and for a single source they may be enough. If you’d like a general assistant to experiment with first, our guide to choosing an AI assistant for your team is a gentle start. A custom build makes sense when the answer lives across several systems.
What we need from you
- Read-only access to the systems that hold your numbers.
- Your five or six Monday questions, in your own words.
- Whoever decides what “revenue” means in your business.
We make a plan and a fixed quote first, and a person approves each connection before it goes live.
A dashboard that nobody trusts is just a nicer-looking spreadsheet. Agree the definitions first.