Key takeaways
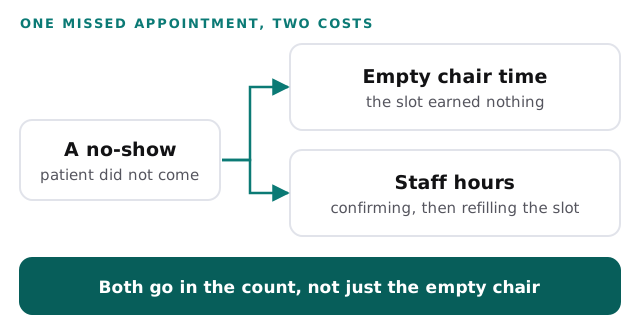
- The cost of dental no-shows has two parts: the empty chair, and the staff hours spent confirming appointments and refilling gaps.
- Published studies of missed dental appointments range from 7.4 percent to 38.6 percent, because each covered a different patient group and setting. Your own schedule is the only number that matters.
- Count from your own schedule: no-shows last year, times what one empty slot would have earned, plus the weekly hours spent on confirmations.
- Reminders on their own do not fill a gap. Look for a tool that drafts the message and leaves the decision to your team.
The cost of dental no-shows has a part you never see on a bill, because it is something that did not happen. A patient does not arrive, the chair sits empty and the hour is gone. Then your team spends more time on the phone trying to fill it.
This post shows how to count both parts from your own schedule, turn them into a yearly figure and decide what is worth fixing first.
Two costs, not one
The empty chair is the visible cost. There is a second one in your payroll.
The empty chair. The slot would have earned something, and it earned nothing. Some of your costs still ran, such as the staff on shift and the rent.
The staff hours. Someone confirms appointments by phone, text or email. Someone chases the people who did not reply. Someone calls the next name on a waiting list when a slot opens. Each task is small, and together they are a part-time job that does not appear in any job description.
Keep the two apart when you count, because they respond to different fixes. A reminder can cut the confirming calls without filling one extra chair, and a busy waiting list can refill chairs while the phone work grows.
What the published studies found
Published no-show rates differ a great deal, because each study covered a different group of patients in a different setting.
In Helsinki, researchers studied the city’s public oral health service for children and adolescents under 18. Across 2,513,376 scheduled appointments between 2006 and 2020, 7.4 percent were no-shows, which the authors defined as failing to arrive without notifying the clinic. They also report that an automated text message reminder system was introduced in 2007, and they suggest it may partly explain why the rate fell over the study period (BMC Oral Health, 2025).
At a government-run paediatric dental outpatient department in Jaipur, India, 886 of 2,294 scheduled patients under 15 failed to attend, a rate of 38.6 percent. The study covered March to August 2014 (J Clin Diagn Res, 2016).
At the UCLA School of Dentistry’s adult general dental clinic, researchers followed 200 adults seeking care for the first time. Of those, 67, or 33.5 percent, failed to show for at least one scheduled appointment within six months (Community Dentistry and Oral Epidemiology, 2014). That figure counts patients who missed at least once, not the share of all appointments missed, so it is not comparable to the other two.
None of these describes a private general practice in your town. A public service for young people, a government children’s dental clinic and a university clinic each have patients and rules of their own. Use the studies to see how much the number can vary, and then count your own.
Count your own year
Export last year’s schedule, or ask your software for a report of missed appointments.
- Count the appointments marked as no-shows, using one rule for what a no-show is.
- Keep a second count for cancellations made too late to refill.
- For one normal week, ask each person who confirms appointments or works the waiting list to log their minutes.
- Decide what one empty slot would have earned, using your own production figure for that appointment length.
For the hourly cost of staff time, use your own payroll number with benefits included. The example uses $30.
These numbers are made up to show the format. Put in yours in the calculator below the table.
| Line | Example | Yours |
|---|---|---|
| People who confirm and refill | 2 | |
| Hours a week each | 3 | |
| Hours a week across the office | 6 | |
| Cost of a staff hour | $30 | |
| Confirming and refilling for the year (6 × $30 × 50) | $9,000 | |
| No-shows last year | 80 | |
| What one empty slot would have earned | $120 | |
| Empty chair time for the year (80 × $120) | $9,600 | |
| Total for the year | $18,600 |
The part you cannot see: the gap that nobody refills
A no-show you hear about the day before is a different problem from one you learn about when the chair is empty. If your team has time to call a waiting list, the slot may be refilled. If the cancellation arrives late in the afternoon for a first-thing visit the next morning, there may be nobody left to ask.
That is why the second tally in the steps above is worth keeping. A late cancellation that was never refilled leaves you with the same empty chair as a no-show. Look through last year’s schedule for gaps where the reason was a late message, and add them to your count if your own rule says they belong.
Why reminder tools do not close the gap
Reminder software is one answer, and it is not a bad one. It handles one task well and leaves the rest where it was. Our page on appointment reminder automation covers how these tools work in more detail.
A text that says “reply C to confirm.” It saves the first round of phone calls. But the patients who do not answer still need a person to try again, and a confirmed patient is not guaranteed to arrive. The text moves the work around and does not remove it.
A waiting-list feature. It helps only if the list is kept current and someone works it. That is another list to maintain, and the call still takes staff time.
A rule that every patient gets a call. It puts a person on the phone for every appointment, so the confirming hours become the main cost. You may trade the empty chair for a larger payroll line.
Another system to log into. Each added tool needs the same patient details and the same schedule. Our post on double data entry looks at what that retyping costs by itself.
Each of these helps with one step. None of them looks at the whole loop, from the cancellation to the refilled slot.
What to look for instead
The fix that works takes routine messages off your team’s desk and leaves the decisions with them.
| Ask for | Instead of |
|---|---|
| Messages drafted for your team to approve | Messages that go out with nobody checking |
| A count of confirmed, unanswered and cancelled, in one view | A spreadsheet you rebuild every Monday |
| A way to see who might fill a freed slot | A waiting list that goes stale |
| A trial on one day’s schedule first | Every patient and every message on day one |
| Your own no-show tally before and after | A promised rate from a vendor’s brochure |
After a month, repeat the weekly log of confirming minutes. The drop in hours, times your hourly cost, times 50, is what the change is worth. For the wider picture, see our page on healthcare practices.
An assistant we built, from the inside
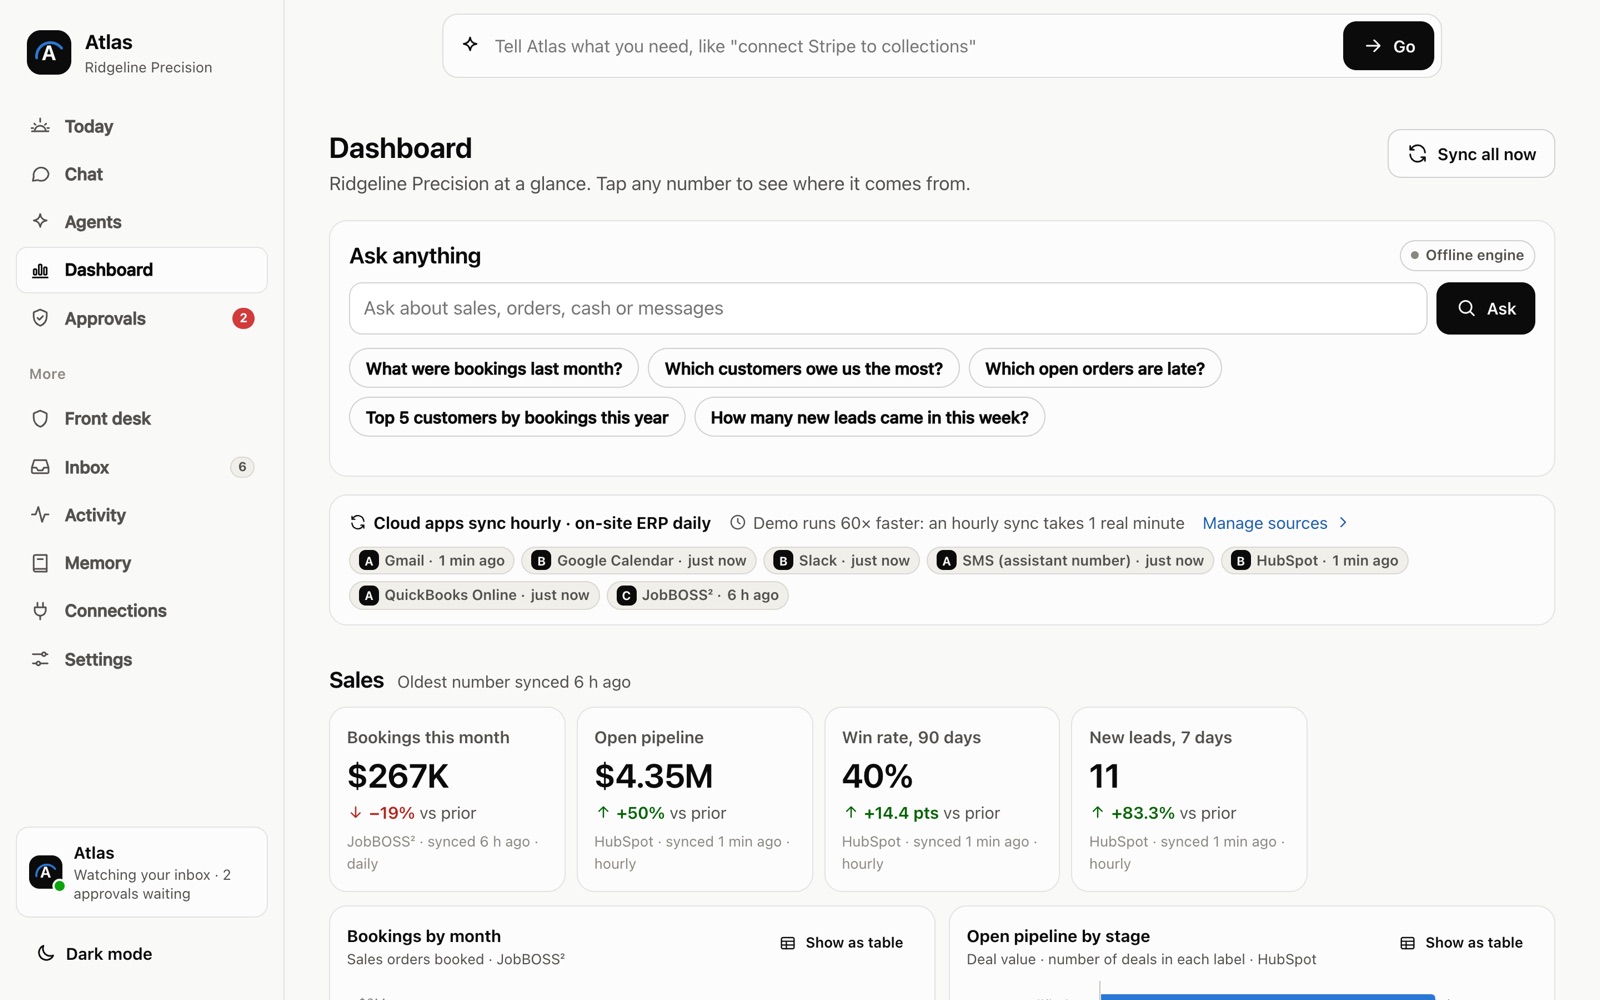
We built an AI assistant that drafts inbox replies for one-tap approval and answers questions about sales, orders and cash. It is a working demo, shown here on sample data.
It isn’t a scheduling tool. We show it because of how it works. A draft waits for a person to approve it, and the person decides what goes out. That pattern, a draft first and a decision second, is the one to hold any tool to when it speaks to your patients.
The interesting part is not the screen. It is how the assistant gets the facts it uses and where a person stays in charge, which is easier to show than to describe.
Behind the scenes
Want a behind-the-scenes walkthrough of a real build?
We will take you through it screen by screen: what each person sees, how a record moves through it, and why we built it that way. Then we can talk about the task that costs you most.
Frequently asked questions
What counts as a no-show when I count them?
Pick one rule and keep it. The Helsinki study below counted a patient who did not arrive and gave no notice, and left out appointments cancelled in advance. You can keep a second tally for short-notice cancellations that were never refilled.
How do I work out what one empty slot costs?
Ask what that slot would have brought in, using your own production figure for that length of appointment. Then take off any supplies and lab costs you did not spend. Use a number you can defend from your own books.
Should I use a published no-show rate for my office?
No. The studies we cite covered a Helsinki public service for young people, a government children's clinic in India and a university clinic for adults. Your rate depends on your patients, so read it off your own schedule.
Sources
- No-shows among children and adolescents in public oral health service: a retrospective register-based study from Finland (BMC Oral Health, 2025)
- Between the Cup and the Lip: Missed Dental Appointments (Journal of Clinical and Diagnostic Research, 2016)
- The association between oral health literacy and failed appointments in adults attending a university based general dental clinic (Community Dentistry and Oral Epidemiology, 2014)
About the author
Andy Kang, AI Partner Team. Andy Kang writes the blog for AI Partner Team, which builds AI tools and internal apps for small businesses alongside managed IT and IT projects. The blog shows the math and the reasoning behind that work, so you can check it against your own business.
- Every fact links to the page it came from, listed under Sources.
- Example numbers are labelled as examples, and you can swap in your own.
- Builds are shown on sample data, with no client names or client figures.