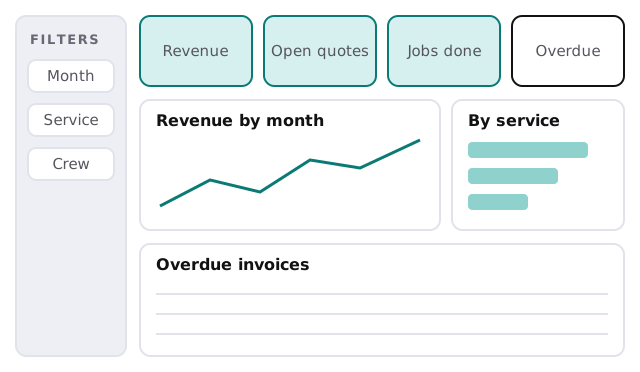
Here’s what Monday looks like once the report exists. The owner opens one page. Revenue, open quotes, jobs done and overdue invoices sit across the top. Below them, a trend line and a breakdown by service. Nobody has asked for a spreadsheet, and nobody has retyped anything. That’s what Power BI dashboard development is for.
If you’re still deciding what to measure and where the data lives, start with a Power BI consultant. This page is about the next step: turning that foundation into specific reports people use.
One page, four zones
We design each report page the same way, so it can be read in seconds. Filters sit down the side, the headline numbers go along the top, trends in the middle and the detail underneath.
One question per page
| Page | The question it answers | Typical visuals |
|---|---|---|
| Owner overview | Are we on track this month? | Four headline numbers, one trend |
| Jobs and schedule | Is the next month full? | Calendar-style grid, jobs by crew |
| Money owed | Who owes us, and for how long? | Aged list, client table |
| Enquiries | Which sources turn into work? | Funnel, source breakdown |
Keep each page to the question in the middle column. When someone asks “can we add one more chart?”, the answer is usually “put it on another page”.
The reason is practical. A report with forty visuals loads slowly, confuses new readers and hides the one number somebody needed. Four focused pages load quickly, and each can be owned by the person who cares about it. They also age better: when the business changes, you edit one page instead of untangling a wall of charts that all depend on each other.
How the build goes
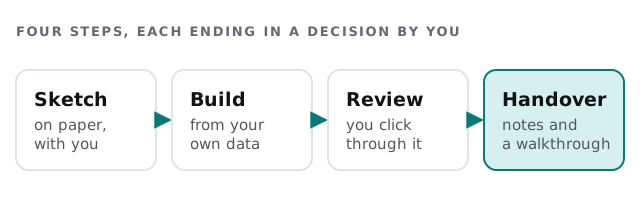
1. Sketch it on paper
We draw each page with you before any software opens. People change their mind cheaply on paper, and expensively in a finished report.
2. Build it on your data
We connect to the source, shape it and build the visuals. Nothing is typed in by hand: if a figure isn’t coming from the data, it doesn’t go on the page.
3. Check it against your books
We pick a month you know well and compare totals to your accounting package, line by line where needed. When they differ, we find out why before you see the report. Often the difference is a definition (“invoiced” versus “paid”), and that’s a useful conversation to have early.
4. Review it with the people who’ll use it
The owner, the office manager and whoever else will open it click through it with us. They find the confusing label in two minutes.
What the handover includes
- A short walkthrough for the people who’ll use the report.
- Written notes: which data each page uses, and how to refresh it.
- A named person on your side who owns the report.
- A clear answer on licences, so you know who can see what. Microsoft’s licence guide says free users can’t share or publish to others’ workspaces, so we check how your team will open it.
You receive a plan and a fixed quote before we start. If the same numbers should also feed a plain-language summary, see our AI KPI dashboard page.
Questions to ask any developer
- Will you check the report against my own totals before I see it?
- Who can edit it once you’ve left?
- Can you show me the sketch before you build?
- What happens when a source changes its columns?
A report you can’t explain to a new hire in five minutes has too many charts.