Most small businesses learn about a stock problem from a customer. “Sorry, we’re out.” Or from the opposite end: a shelf of something that was a good idea two years ago. An inventory dashboard for small business is the screen that spots both before they cost you, using numbers that already sit in your spreadsheets, till and supplier emails.
Tuesday, 8:15 am
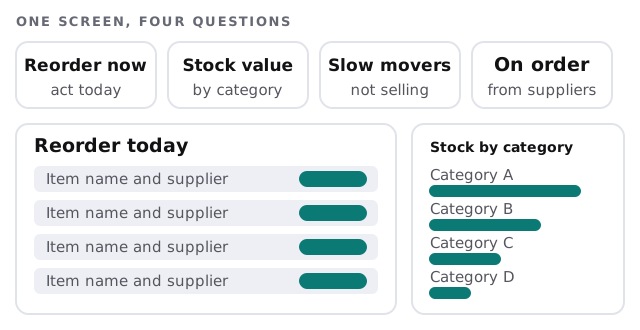
You open the page with your coffee. The top-left tile says four items have reached their reorder point. Below it is a short list: each item, its supplier and how many days of stock are left at the current pace. You tick two, and the supplier emails are drafted for you to send. The page also shows that one product has not sold in months. You didn’t search for any of that, and it took two minutes.
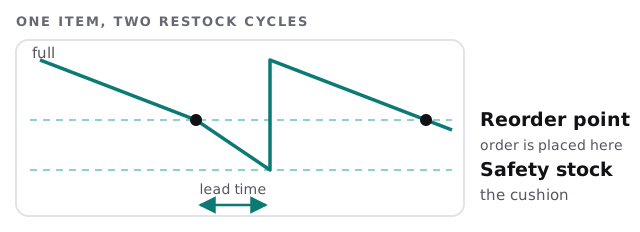
The one formula behind “reorder now”
The key number is the reorder point. The usual way to work it out is:
- Average sales per day, multiplied by the days your supplier takes to deliver.
- Plus a safety cushion for slow deliveries or a busy week.
When stock falls to that figure, the item appears on the list. The cushion is a business decision, not a technical one: carry more for the items you can never be out of, less for the ones you can back-order.
Where each number comes from
| Tile | Usually fed by | The catch to plan for |
|---|---|---|
| Stock on hand | A spreadsheet, a till export or a platform feed | Two sources that disagree, so one must be the master |
| Sales pace | Recent sales over a window you choose | Seasonal products need a longer window |
| Supplier lead time | Your own past orders | Needs a first guess, then it learns from reality |
| On order | Purchase orders or supplier emails | Orders placed by phone never reach the sheet |
Two habits keep the numbers believable. Every tile shows when its source was last updated, so a stale figure looks stale. And any item you adjust by hand, after a damaged delivery or a stock count, is logged with a reason, so next month’s odd number has an explanation.
How we build it
- Pick the master list. One place that holds the truth about each item.
- Connect the feeds. Sales and stock come in on a schedule, with the last update time shown.
- Set the rules with you. Reorder points and cushions, product by product where it matters.
- Show exceptions first. The default view is what needs action, not everything.
- Add an alert if you want one. A message when a key item crosses its line.
Signs you need one
- You find out about stock-outs from customers.
- Two people keep two different lists.
- Cash is tied up in products you can’t name off the top of your head.
- Reordering depends on one person’s memory.
When a spreadsheet is enough
If you have under a few dozen items and one person does all the buying, a well-built sheet beats any dashboard. Excel automation can add the reorder flag. Come to us when several people, several channels or several sources are involved. For a more specialised stock problem, such as one-off pieces, see custom inventory software for jewelry stores. If you want the dashboard to cover sales and cash too, an AI KPI dashboard is the wider version.
What we need from you
- A sample of your stock list and a month of sales.
- Names of your main suppliers and roughly how long each takes.
- The three items that hurt most when they run out.
You get a plan and a fixed quote before we build, and a person on your side signs off the reorder rules.
A dashboard earns its place by shortening one decision. If a tile doesn’t change what you do tomorrow, it comes off.